
America became dramatically wealthier during the second quarter of 2026. The Federal Reserve calculates that household and nonprofit net worth increased by approximately $12.8 trillion in three months, reaching $195.9 trillion. Corporate equity holdings accounted for roughly $10.7 trillion of that quarterly increase. On paper, it was an extraordinary expansion of American wealth. But paper wealth and lived prosperity are not synonymous. Consumer prices in August were 3.4% higher than a year earlier, while real average hourly earnings for private-sector employees were 0.3% lower. A worker can therefore watch the country’s aggregate balance sheet expand while discovering that the same hour of labour buys slightly less. Neither statistic invalidates the other. They are measuring different economies. WTM proposes that Americans increasingly experience three overlapping economic systems: the Wage Economy, which determines what labour pays; the Cost Economy, which determines what life requires; and the Asset Economy, which determines what accumulated ownership does without another hour of labour being sold. The distribution matters. Federal Reserve data for the first quarter of 2026 show that the bottom half of households collectively held only about $590 billion in corporate equities and mutual-fund shares. The top 0.1% alone held approximately $13.33 trillion; the remainder of the top 1% held another $14.31 trillion. Rising markets can therefore increase national wealth enormously without distributing the increase evenly. This is not evidence of a conspiracy. It is evidence of architecture. The American wealth divide is not only about who earns more. It is increasingly about who owns the machinery that compounds while everyone else is working. The question for the household is consequently not merely: How much do I make? It is: What enters my wallet, what leaves it, what compounds against me — and what do I own that can compound for me?

The number is sufficiently large to become almost meaningless: $12.8 trillion. That is how much household and nonprofit net worth increased during the second quarter of 2026, according to the Federal Reserve’s Financial Accounts. Aggregate net worth rose from $183.1 trillion in the first quarter to $195.9 trillion in the second. Total household assets reached $217.8 trillion against $21.9 trillion of liabilities. By one of the broadest measures available, the American household sector has rarely looked richer.
But look inside the number and the story changes. Of that $12.8 trillion quarterly increase, approximately $10.7 trillion came from direct and indirect corporate equity holdings. Real estate contributed roughly $1.13 trillion. America did not collectively receive a $12.8 trillion pay rise. Companies did not deposit the money proportionately into 130 million household bank accounts. Much of the increase resulted from assets being valued more highly.

That distinction explains one of the strangest sensations in contemporary economic life. A newspaper can announce record wealth on the same morning that a household worries about its grocery bill. A retirement portfolio can rise while an insurance renewal becomes painful. A homeowner can become wealthier because the house appreciates while simultaneously feeling poorer because moving to another house has become less affordable. Economic statistics are not necessarily contradicting lived experience. They may simply be observing different layers of it.
Inflation makes the divergence more visible. The Consumer Price Index was 3.4% higher in August than a year earlier. Real average hourly earnings, which adjust nominal wages for consumer prices, were 0.3% lower over the same period. Someone whose financial security depends overwhelmingly upon wages can therefore experience deterioration in purchasing power while someone with substantial equity exposure experiences a large increase in net worth.
This is why the phrase Americans are wealthier needs an immediate second question: Which Americans, through which assets, and how accessible is that wealth? A pension balance is wealth. Home equity is wealth. A privately owned company is wealth. None necessarily pays tomorrow morning’s electricity bill. Liquidity, income and net worth are related, but they are not interchangeable.
The first principle of wallet intelligence is therefore deceptively simple: national wealth is not household cash flow. Aggregate prosperity tells us something important about the country’s accumulated resources. It tells us considerably less about whether a particular family can comfortably absorb a $2,000 emergency next Tuesday. To understand that household, we need to leave the national balance sheet and enter the wallet.
Most people encounter money first as income. Work produces wages. A business produces earnings. Government programmes or pensions may provide payments. Money arrives, bills leave, and whatever survives becomes savings. Because this cycle repeats every month, income can easily become the intuitive measure of financial success. Yet income answers only one question: How much economic value flows towards you during a period of time?

Wealth asks another: What do you own after subtracting what you owe? Someone earning $300,000 annually while spending $290,000 and carrying expensive liabilities may possess less financial resilience than someone earning $120,000 with substantial retirement assets, manageable housing costs and little high-interest debt. Salary describes flow. Net worth describes accumulated position. Neither alone describes financial health.
The distinction becomes more consequential because labour and capital behave differently. Labour usually requires continued participation. Stop working and, for most households, the principal income stream eventually stops. Productive assets can behave differently. A diversified equity portfolio can participate in corporate earnings. A profitable business can produce distributable cash flow. Bonds can pay interest. Property may produce rent or appreciate. Ownership can create economic participation without requiring every dollar to correspond to another hour worked.
That does not make assets magical. Equities fall. Businesses fail. Property requires maintenance and can lose value. Bonds carry risks. Ownership is not a guarantee of compounding; it is exposure to the possibility of returns and losses. But the structural distinction remains: labour monetises human effort; capital monetises ownership. Households possessing both have two potential engines. Households possessing principally the first remain more dependent upon the labour market.
Debt introduces the inverse mechanism. Compounding can work against a household. Interest on a high-cost credit balance consumes future income before that income arrives. Financing an appreciating or income-producing asset may sometimes increase long-term capacity; repeatedly financing consumption at high rates can reduce it. The important distinction is not the moralised slogan that all debt is bad. It is whether the liability increases future productive capacity or persistently extracts from it.
This produces a more useful definition of financial progress. A pay rise matters. But what happens after the pay rise matters more. If every additional dollar becomes permanently higher consumption, income has increased without necessarily building much capital. If some portion becomes liquidity, debt reduction, retirement ownership, education or productive investment, income has been converted into capacity.
The household wealth question therefore begins with a conceptual separation: earnings sustain the present; ownership can finance the future. The objective is not to diminish work. Human labour remains the primary economic asset for millions of people. The objective is to understand what labour can build besides consumption. A wallet is not only a place through which money passes. Properly designed, it is the entrance to a balance sheet.
There is no single American economy in the way households experience it. There are at least three interacting ones. THE WAGE ECONOMY determines what work pays. THE COST ECONOMY determines what ordinary life consumes. THE ASSET ECONOMY determines what ownership gains or loses. Every household participates in all three to some degree, but not in equal proportions.
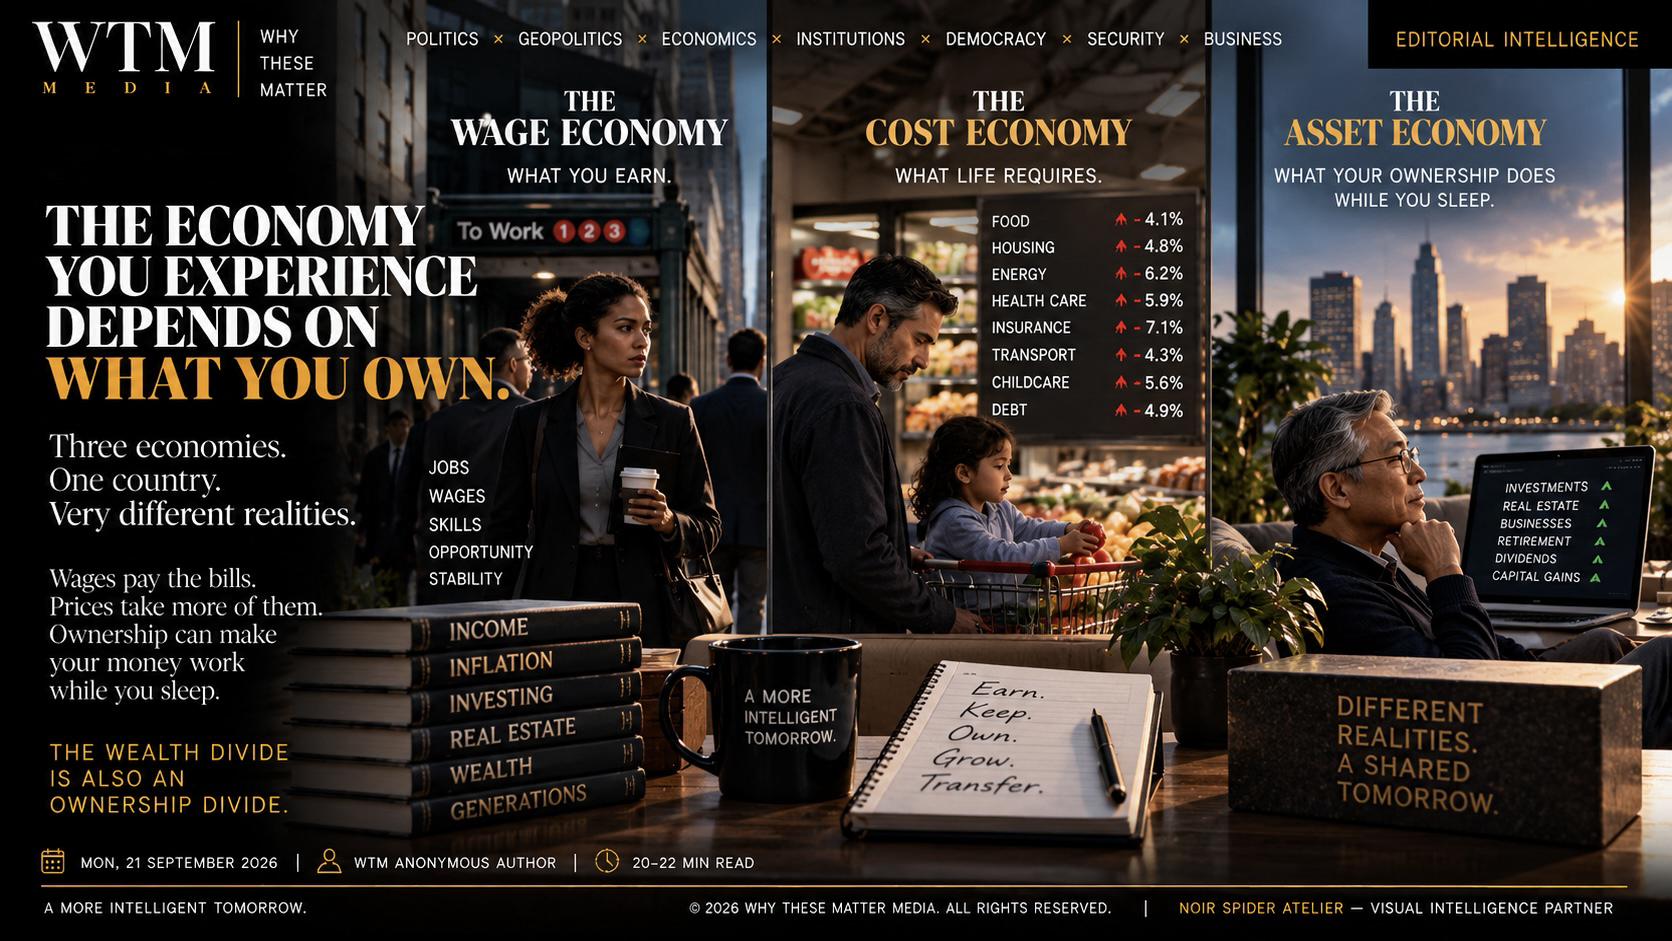
Imagine a household whose principal asset is labour. Most income comes from salaries. Rent, food, transport, healthcare, utilities and insurance absorb much of it. There may be some retirement saving, but little investable capital outside it. When consumer prices rise faster than wages, this household experiences the economy as compression. More work may be required simply to preserve yesterday’s standard of living.
Now consider a household with substantial ownership. Its members may also work, but they own equities, businesses, property, bonds or other productive assets. Rising prices still affect consumption, but asset appreciation may increase the household’s balance sheet by considerably more than higher grocery or utility bills subtract from annual cash flow. Inflation can still hurt. Higher interest rates can still reduce valuations. The difference is that this household possesses more mechanisms through which economic expansion can reach it.
Federal Reserve distributional data make the ownership asymmetry unusually clear. In 2026:Q1, the bottom 50% held about $590 billion in corporate equities and mutual-fund shares. The top 0.1% held approximately $13.33 trillion, and households between the 99th and 99.9th percentiles held another $14.31 trillion. The middle 40% — households from the 50th to 90th wealth percentiles — held roughly $6.4 trillion. When equities surge, exposure to that surge is profoundly unequal.
Asset composition matters too. The same Federal Reserve data show that real estate plays a substantial role further down the wealth distribution, while equity and business ownership become increasingly important near the top. This means two households can both be called “wealthy” while possessing very different kinds of wealth: one may have much of its net worth locked inside a home; another may hold liquid securities, businesses and diversified financial claims.
The resulting divide is therefore not merely rich versus poor. It is income-dependent versus ownership-participating, with millions of households existing somewhere between those poles. Retirement accounts matter precisely because they allow workers to become partial owners of productive enterprise. Homeownership can build wealth, but it also concentrates capital in one property and one geography. Business ownership can create extraordinary upside alongside extraordinary concentration risk.
This is the structural insight beneath the headline. The American wealth divide is not only about who earns more. It is increasingly about who owns the machinery that compounds while everyone else is working. That sentence should not produce fatalism. It should produce financial literacy. If ownership changes the economy a household experiences, then access to responsible ownership becomes one of the most consequential questions in personal finance.

Volatility is usually described as danger because for households with thin financial margins it often is. A sudden rise in food, energy or insurance costs can destabilise a budget. Higher borrowing rates can make credit-card balances more expensive and home purchases less attainable. A job loss can turn a manageable financial structure into an emergency. When little surplus exists, volatility arrives principally as something to survive.
For households with substantial liquidity and investable capital, volatility can create a different set of possibilities. Higher interest rates can increase yields on cash equivalents and newly issued fixed-income assets. Falling asset prices can allow long-horizon investors to purchase productive assets at lower valuations. Distressed businesses or property can become acquisition opportunities. The same economic disturbance can therefore be a liability for one balance sheet and an opportunity set for another.
That asymmetry does not demonstrate that wealthy Americans collectively engineer crises to enrich themselves. Such a claim would require evidence far beyond unequal outcomes. Markets can distribute gains asymmetrically through ordinary ownership mathematics. If Household A owns $10 million of equities and Household B owns $10,000, a 10% increase creates radically different dollar gains even though both portfolios experience the same percentage return.
The reverse also matters. Owners of substantial risk assets can lose enormous sums during market declines. Concentrated entrepreneurs can see years of paper wealth disappear. Leveraged property investors can be damaged by refinancing costs. The asset economy does not guarantee upward mobility to everyone who enters it. It distributes risk as well as return. The advantage of capital is not immunity from volatility; it is often greater capacity to endure volatility without being forced to sell at the worst possible moment.
Liquidity is therefore a hidden form of power. A household with cash reserves can absorb a broken furnace without revolving debt. It can tolerate temporary unemployment longer. It can avoid liquidating retirement assets during a market fall. It may even have capital available when assets become cheaper. Two households with identical net worth but radically different liquidity can have radically different vulnerability.
The deeper divide is consequently between forced reaction and available choice. Economic shocks become most destructive when households have no room to decide. Building financial resilience is not about learning to predict every recession, rate decision or market correction. It is about constructing a balance sheet capable of surviving uncertainty long enough to preserve agency.
“The 1%” is useful shorthand for extreme economic concentration. It can also become intellectually misleading when shorthand turns into a theory of human permanence. Income and wealth are related but different distributions, and the people occupying the highest annual income bracket are not exactly the same people year after year.
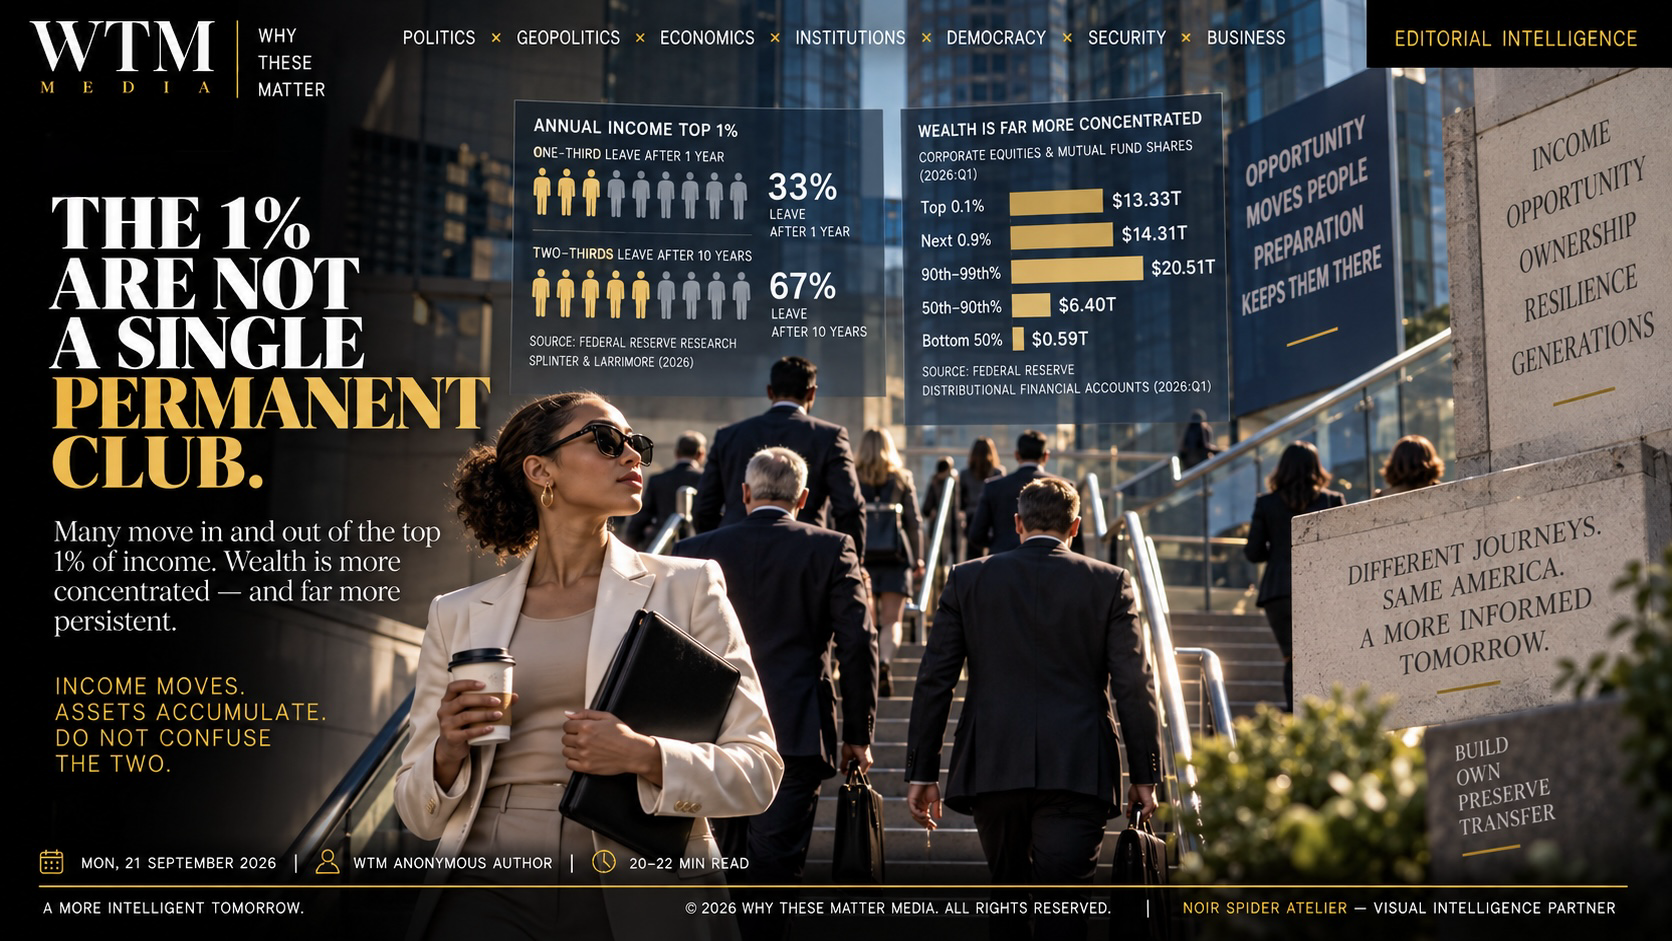
Federal Reserve researchers David Splinter and Jeff Larrimore examined movement into and out of the top 1% of fiscal income. Their March 2026 research finds substantial circulation: approximately one-third of people in the annual top 1% leave it by the following year, and roughly two-thirds are no longer there a decade later. That is a significant corrective to the idea of an entirely fixed income elite.
But mobility does not erase concentration. The same Federal Reserve system documents extraordinary differences in asset ownership across wealth groups. Someone can leave the top 1% of annual income while retaining substantial accumulated wealth. Another person can briefly enter the top income percentile because of a business sale, bonus or unusually successful year without possessing the multigenerational asset base associated with the very wealthiest households.
This is why income percentile and wealth percentile should never be treated as synonyms. A surgeon early in a high-earning career may have substantial income and considerable educational debt. A retired founder may report comparatively modest annual labour income while owning tens of millions in assets. A small-business owner can have high paper wealth concentrated in an illiquid company. Economic position is multidimensional.
Generational transfer adds another layer. Assets can outlive the labour that created them. Capital can finance education, housing deposits, business formation and future investment for descendants. Debt can also travel indirectly across generations by limiting what parents can provide. Wealth therefore affects not merely consumption but the range of risks a family can afford to take.
A serious wealth conversation should consequently resist two temptations at once: pretending economic concentration is insignificant and pretending the economic hierarchy is completely immobile. Both erase useful information. Concentration tells us where capital resides. Mobility tells us that annual income status changes more than static snapshots imply. Asset composition tells us why those facts can coexist.
The objective is not to turn every household into “the 1%”. That framing reduces financial architecture to status competition. A more useful ambition is capacity: enough liquidity to withstand shocks, enough ownership to participate in growth, enough protection to prevent a single event from destroying years of progress and enough accumulated capital to increase the choices available to the next stage of life.
The wrong conclusion from this editorial would be that everyone should rush into the stock market because equities just created trillions of dollars of paper wealth. That substitutes speculation for understanding. Asset prices can fall as decisively as they rise. No household becomes financially sophisticated merely by owning a ticker symbol.

The first architecture is liquidity. Before maximising return, a household needs some capacity to absorb surprise. The appropriate emergency reserve varies with income stability, dependants, insurance, housing, health, debt and other circumstances. Its function is not to outperform equities. Its return is the preservation of choice when something goes wrong.
The second architecture is debt and protection. Know which liabilities compound against you, their interest rates and their purpose. Understand insurance not as an irritating recurring expense but as a mechanism for transferring risks capable of destroying a balance sheet. Health, property, liability, disability and life risks differ by household; protection should follow actual exposure rather than generic formulas.
The third is ownership. Workplace retirement plans, IRAs and diversified productive assets can allow labour income gradually to purchase participation in the asset economy. Diversification matters because owning productive assets and gambling on individual assets are not the same behaviour. Housing should similarly be evaluated as shelter, financing commitment and concentrated asset — not automatically as a guaranteed investment.
The fourth is human capital. Skills, judgement, credentials, networks, adaptability and health can expand earning capacity for decades. For households without inherited capital, human capability is often the first asset capable of financing the acquisition of other assets. The false choice between investing in yourself and investing financially misses the sequence: one can create the surplus that funds the other.
The final architecture is time. Wealth rarely feels dramatic while it is being constructed. The household moves from income to surplus, from surplus to ownership, from ownership to compounding and, eventually, from compounding to optionality. The objective is not conspicuous richness. It is to reduce the number of circumstances in which money removes your ability to choose.
A wealthy country is not the same thing as a financially secure household. The bridge between the two is ownership, protection, discipline and time.
The Federal Reserve’s 11 September Financial Accounts release reports household and nonprofit net worth of $195.9 trillion in 2026:Q2, up from $183.1 trillion in Q1. The Fed’s changes-in-net-worth table puts the quarterly increase at $12.803 trillion, including approximately $10.711 trillion associated with direct and indirect corporate-equity holdings and $1.131 trillion from real estate.
August CPI-U increased 0.4% month over month and 3.4% year over year. BLS’s August real-earnings release reports real average hourly earnings for all private nonfarm employees decreased 0.3% from August 2025 to August 2026. Real average weekly earnings nevertheless increased 0.3% over the year because the average workweek increased. That distinction should remain in the published piece so the editorial does not imply that every inflation-adjusted measure of labour compensation declined.
Federal Reserve Distributional Financial Accounts for 2026:Q1 report corporate equities and mutual-fund shares of approximately $13.33T for the top 0.1%, $14.31T for the next 0.9%, $20.51T for the 90th–99th percentiles, $6.40T for the 50th–90th percentiles and $0.59T for the bottom 50%. These are asset levels, not annual income.
Federal Reserve researchers David Splinter and Jeff Larrimore report substantial movement through the annual income top 1%: approximately one-third exit after one year and two-thirds after a decade. The paper explicitly notes that the research represents the authors’ analysis and does not imply concurrence by the Board of Governors.
The editorial deliberately does not infer coordinated exploitation from unequal asset ownership. The distributional mechanism discussed here requires no conspiracy: households with greater exposure to appreciating assets receive larger dollar gains when those assets appreciate. Conversely, asset owners also bear market losses.
The Wage Economy, Cost Economy and Asset Economy, The Wallet Test™, the forced reaction / available choice distinction and the sequence LABOUR → SURPLUS → RESILIENCE → OWNERSHIP → COMPOUNDING → OPTIONALITY → LEGACY are original WTM Editorial Intelligence analytical constructs. They are explanatory frameworks, not validated financial-planning instruments.
This editorial provides general economic and financial education. Household decisions concerning investments, debt, insurance, taxation and estate planning depend upon individual circumstances and may require appropriately qualified professional advice.
Copyright
© 2026 Why These Matter Media. All rights reserved.
Author: WTM Anonymous Author
Editorial Intelligence: Why These Matter Media
Visual Intelligence Partner: Noir Spider Atelier™
Research foundation: Board of Governors of the Federal Reserve System; U.S. Bureau of Labor Statistics; Federal Reserve Distributional Financial Accounts; Federal Reserve Finance and Economics Discussion Series.
Third-party names, data and intellectual property remain the property of their respective owners and are referenced for reporting, analysis, commentary and attribution.
WTM governing proposition: Income tells you what arrives. Wealth tells you what remains. Financial architecture determines what can grow.

Why These Matter - WTM MEDIA is an independent editorial platform exploring the forces shaping our world—through people, culture, commerce, design, systems, and governance. Connecting the dots between today’s headlines and tomorrow’s realities.